Monitor dbt State activity
Learn how to monitor dbt State activity in dbt platform for better visibility into model builds and cost savings.
dbt State monitoring helps you:
- Track effectiveness of dbt State — See how dbt State reduces unnecessary model rebuilds by only building models when there are changes to the data or code. dbt State provides transparency into how the optimization works across your projects.
- Analyze build patterns — Gain insights into your project's build frequency and identify opportunities for further optimization.
dbt State metrics
When you go to Account settings > Billing & Usage > Usage-based features, the State tab shows how many days remain in your trial period. Once dbt State is enabled, it displays the following for the current month:
- Models reused this month: How many model builds dbt State skipped or cloned instead of rebuilding from scratch.
- Total % build reduction: The overall reduction in model builds across your account.
- Total query run time reduction: The total time dbt State saved by not executing unnecessary model builds.
The State tab also displays the following charts:
- DATT — Shows the target tables processed by dbt State, split into Billable and Free. Daily active target tables (DATTs) are the billable units for dbt State. During a trial, all DATTs are counted as free.
- Asset builds — Shows all model builds for the month, including models reused and cloned.
Lag tolerance recommendations
The dbt State page, which you can access from the left-side menu of the dbt platform, includes a Lag tolerance recommendations section that identifies models that could safely tolerate more lag, letting dbt State skip more runs and save additional compute.
The recommendations table displays the following columns:
| Column | Description |
|---|---|
| Model name | The name of the model that could benefit from a higher lag_tolerance value. |
| Project | The dbt project the model belongs to, as set by name: in dbt_project.yml. This may differ from the project name in the dbt platform. |
| Current lag | The model's current lag_tolerance setting. |
| Recommended lag | The lag_tolerance value dbt State recommends based on your model's 30-day build history. |
| % time saved | The estimated percentage of build time you'd save by applying the recommended lag_tolerance. |
| Projected 30d time savings | The estimated build time you could save over the next 30 days by applying the recommended lag_tolerance, based on redundant builds in the previous 30 days. This estimate includes only this model, so actual savings may be higher if downstream models also do not rebuild. |
You can search for a specific model using the search bar, or filter recommendations by project using the Project dropdown menu.
To apply a recommendation, update the model's lag_tolerance config. For configuration syntax and examples, refer to the lag_tolerance config page.
How dbt State calculates recommendations
dbt State analyzes each model’s build history from the previous 30 days. Models with fewer than 10 recorded builds are excluded because there isn't enough history to make a reliable recommendation.
For each eligible model, dbt State:
- Identifies builds where the model’s definition and inputs had not changed since the previous build.
- Estimates the build time that different
lag_tolerancevalues would have saved. - Recommends the smallest value that would have saved more than 30 minutes, helping reduce redundant builds while keeping data as fresh as possible.
A model doesn’t appear in the table if it’s a view or its current lag_tolerance value is already equal to or greater than the recommended value. Each account displays 20 models with the highest projected savings.
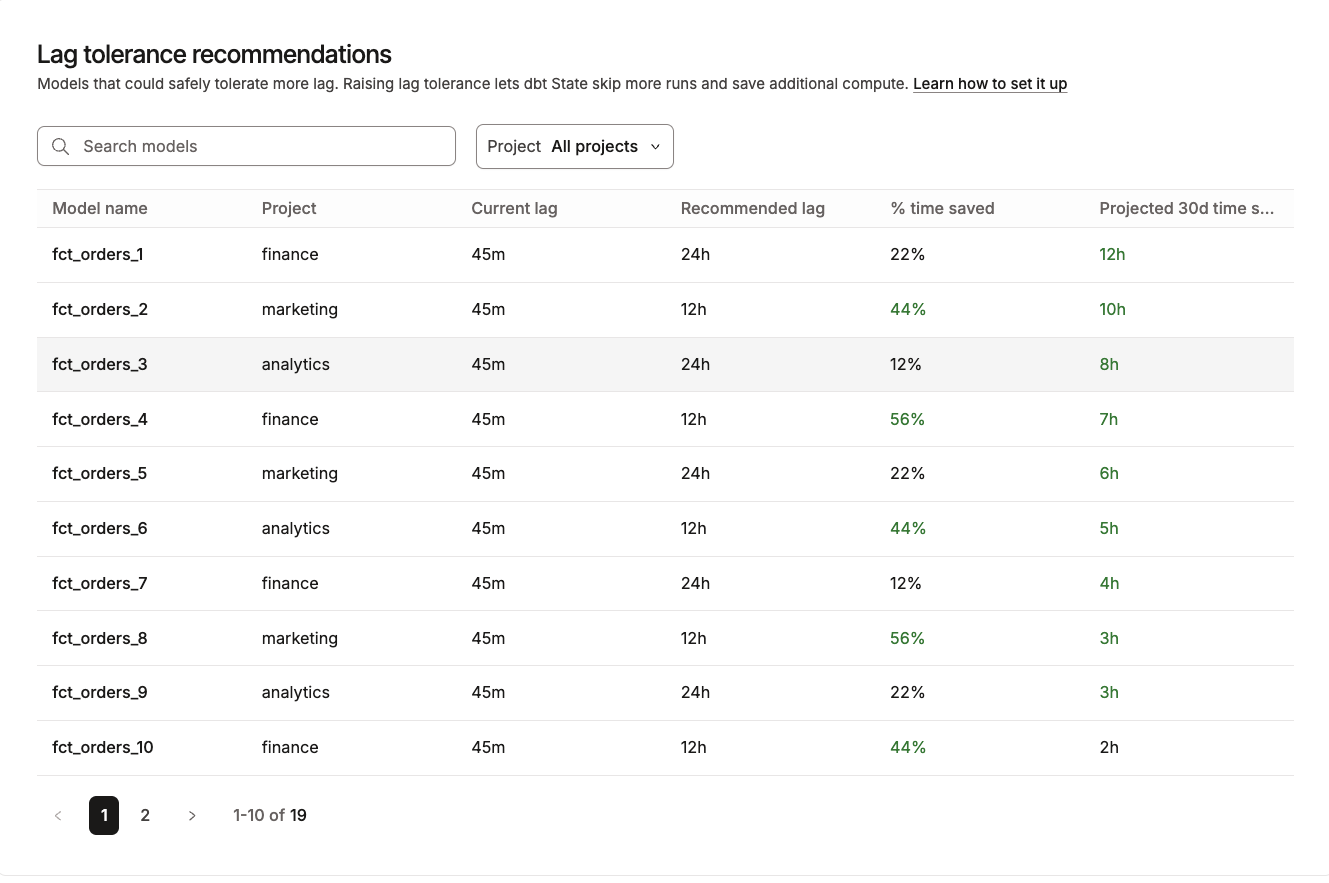 Lag tolerance recommendations
Models built and reused chart
When you go to your Account home, you'll see a chart showing the number of models built and reused, giving you visibility into how dbt State is optimizing your data builds. You can also view the number of reused models per project on Account home.
Logs view of built models
When you run a job, or when you run dbt run or dbt build locally, a structured logs view shows which models were built, skipped, or reused.
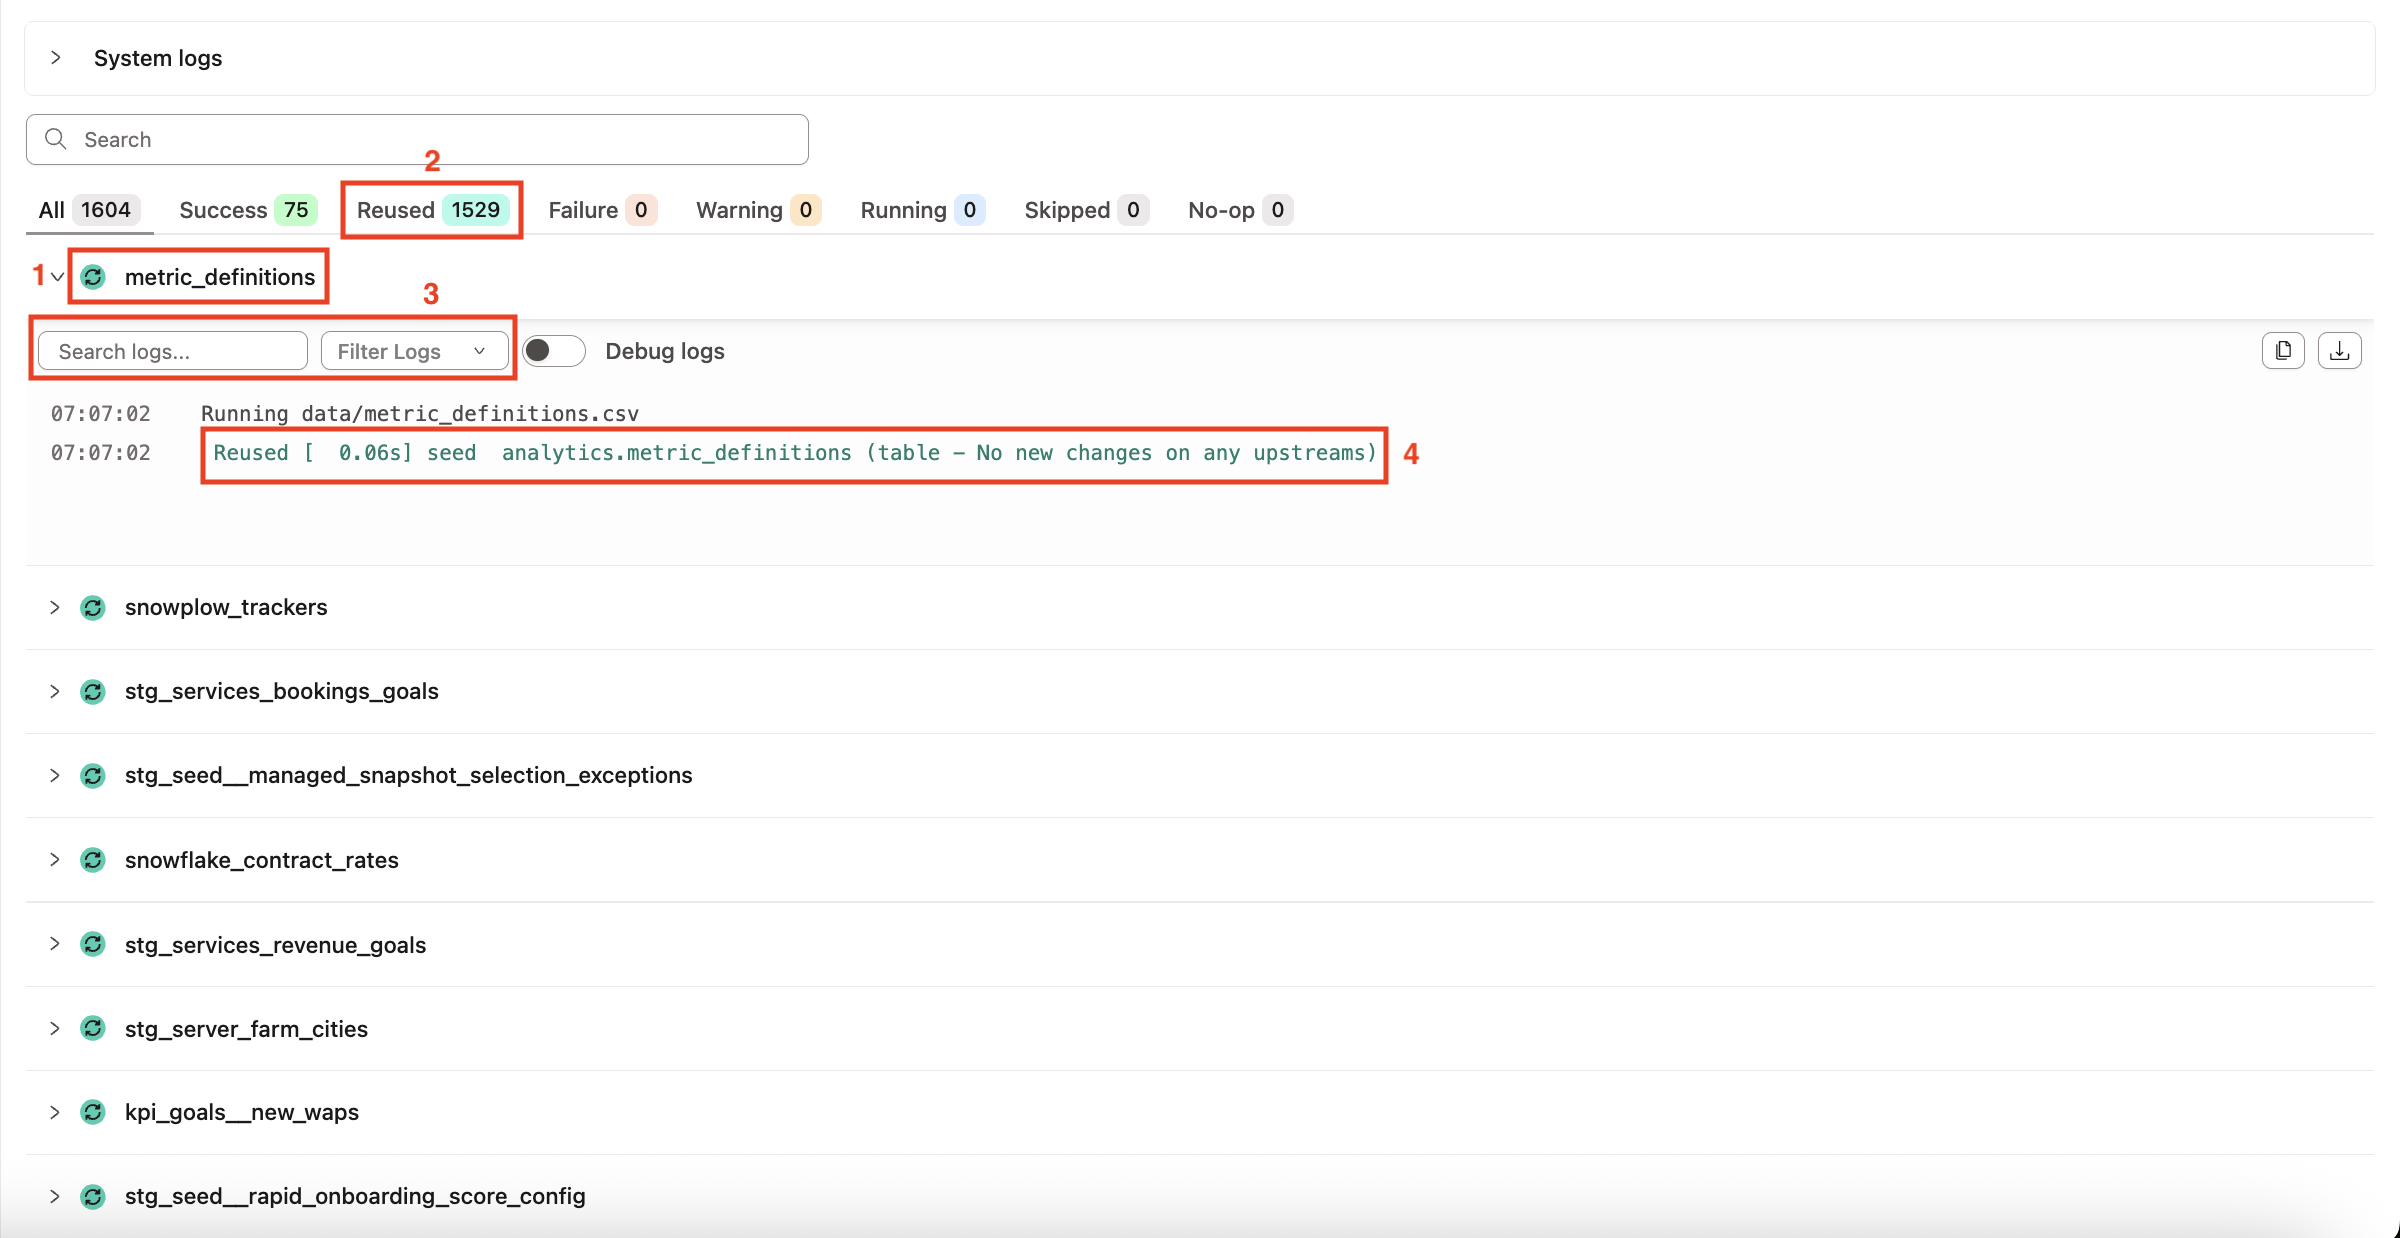 Logs view of built models
- Each model has an icon indicating its status.
- The Reused tab indicates the total number of reused models.
- You can use the search bar or filter the logs to show All, Success, Warning, Failed, Running, Skipped, Reused, or Debugged messages.
- Detailed log messages provide context on why models were built, reused, or skipped. These messages are highlighted in the logs.
Reused tag in the Latest status lens
Lineage lenses are interactive visual filters in dbt Catalog that show additional context on your lineage graph to understand how resources are defined or performing. When you apply a lens, tags become visible on the nodes in the lineage graph, indicating the layer value along with coloration based on that value. If you're significantly zoomed out, only the tags and their colors are visible in the graph.
The Latest status lens shows the status from the latest execution of the resource in the current environment. When you use this lens to view your lineage, dbt State tags reused models with Reused.
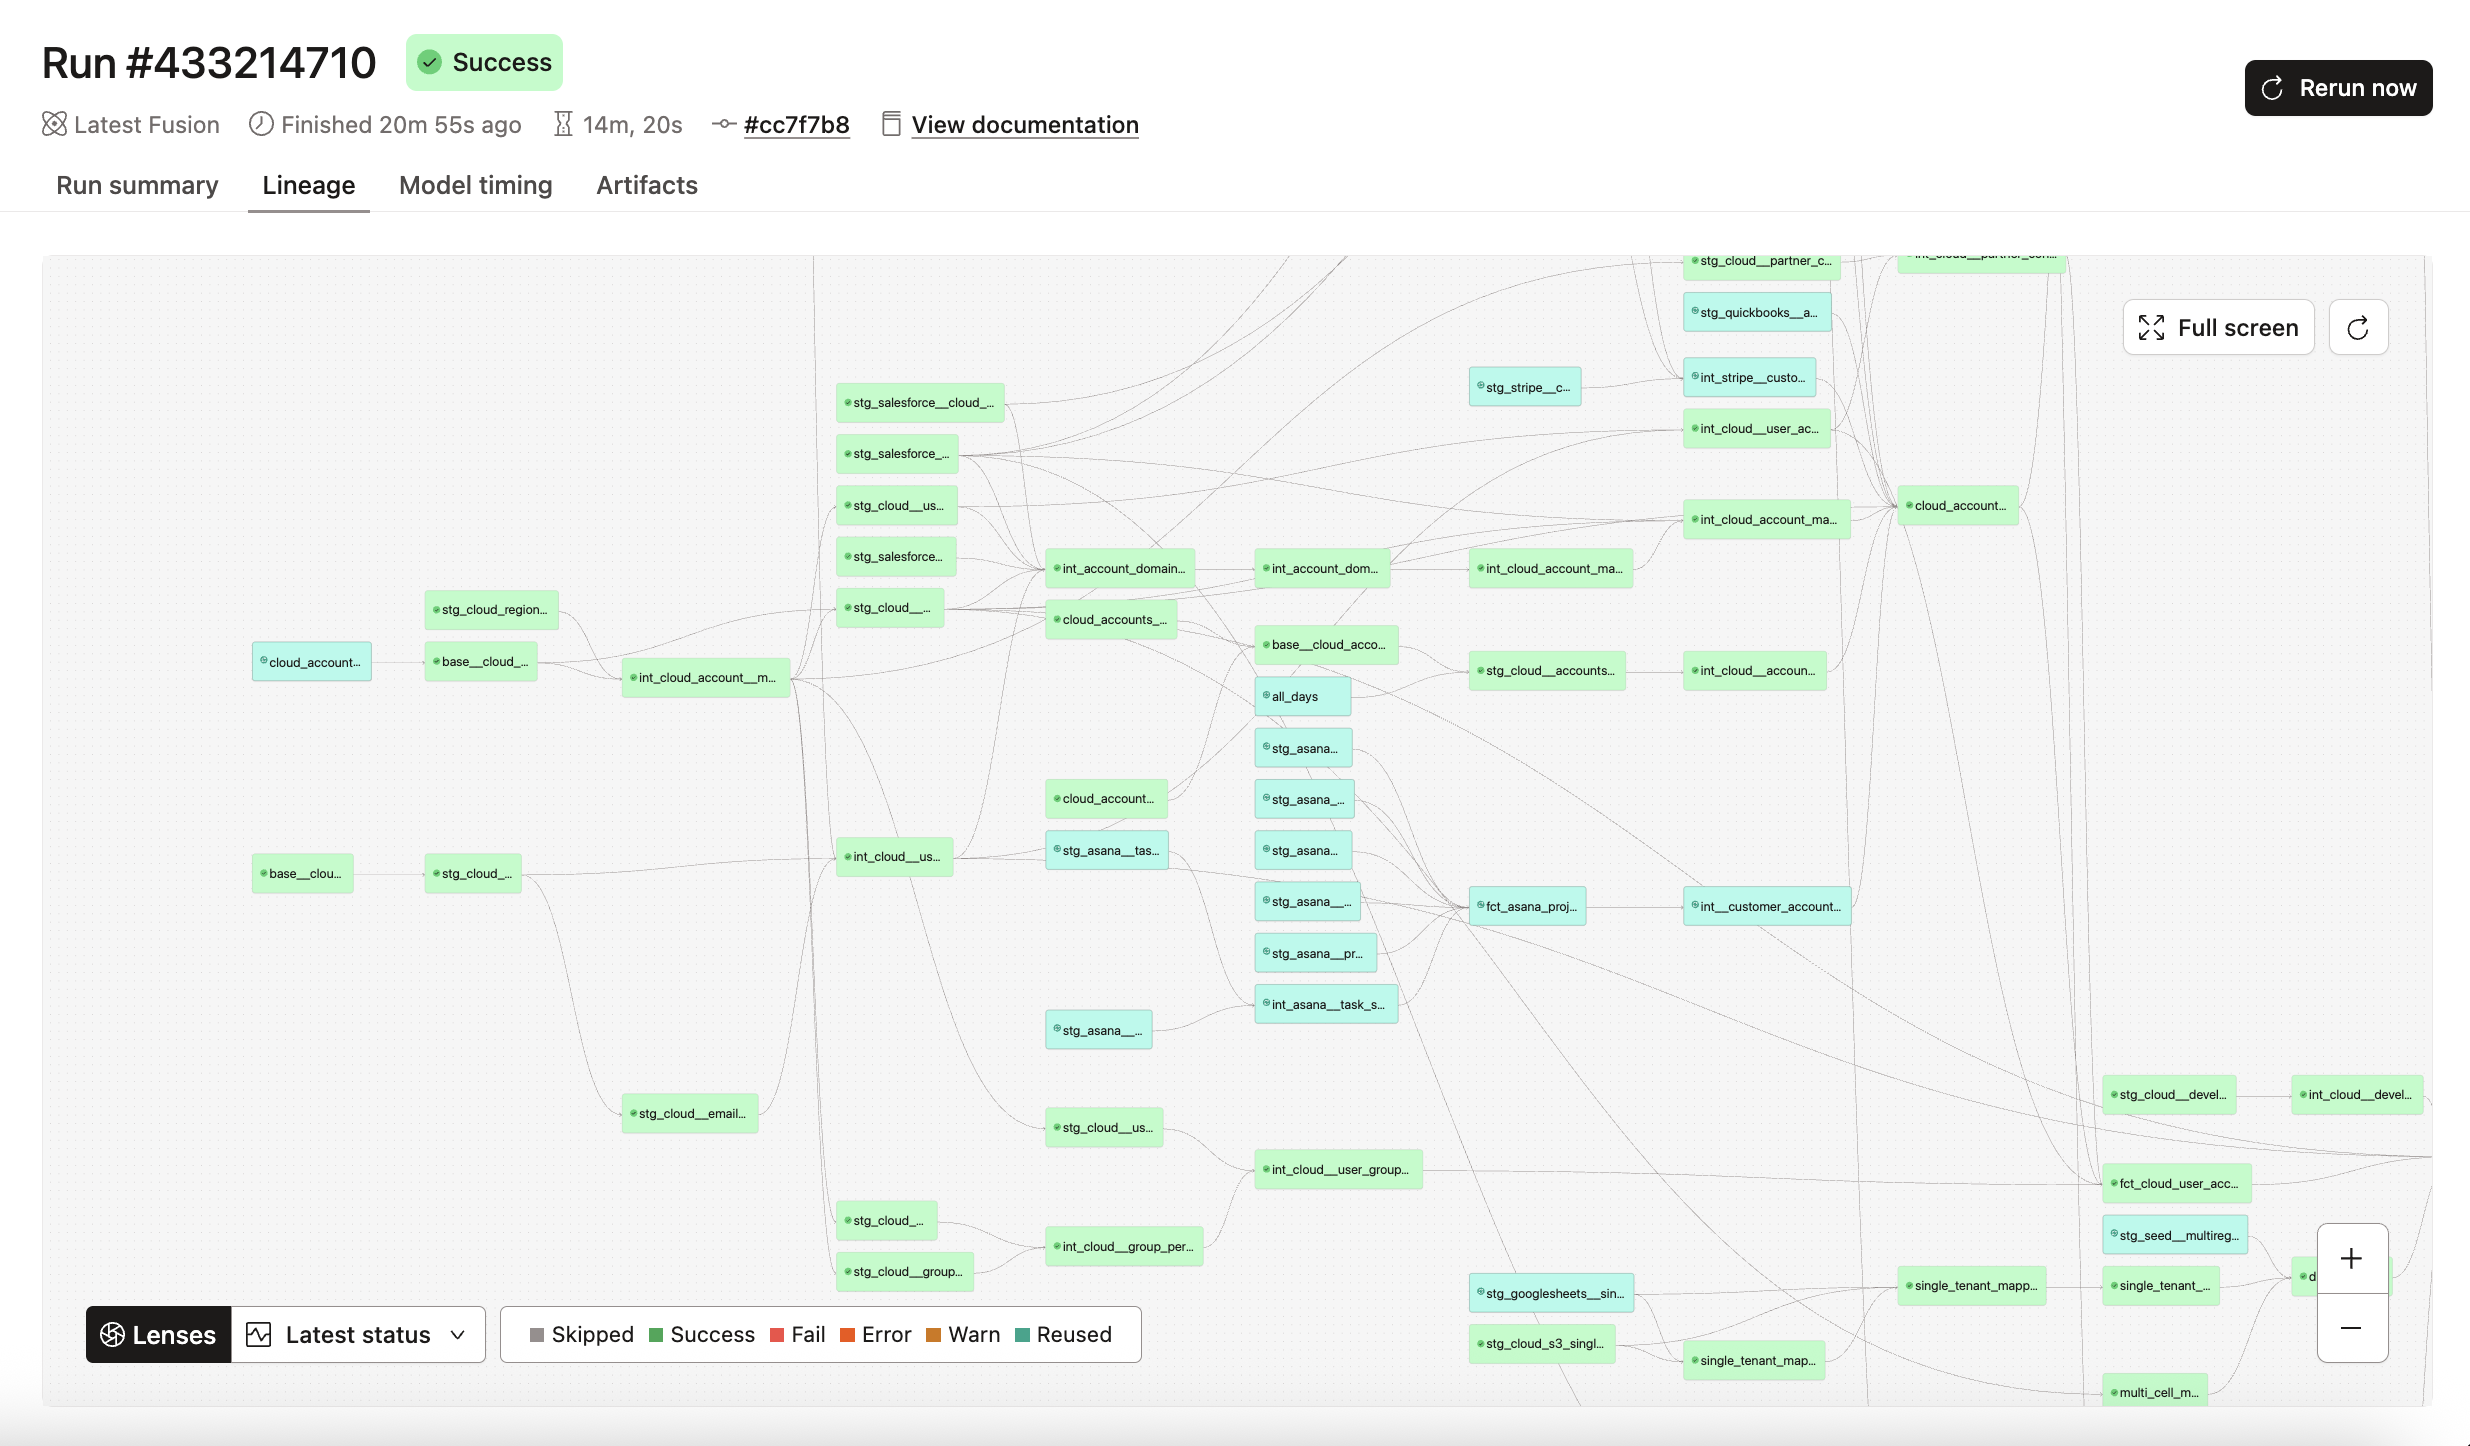 Latest status lens showing reused models
To view your lineage with the Latest status lens:
- From the main menu, go to Orchestration > Runs.
- Select your run.
- Go to the Lineage tab. You'll see your project's lineage.
- In the Lenses field, select Latest status.
Explain tab
To see why dbt State rebuilt, reused, or cloned a specific resource, go to Orchestration > Runs. Select a run and go to the Explain tab.
The Explain tab appears on job runs that used dbt State. It shows why dbt State rebuilt, reused, or cloned each resource, so you can investigate unexpected behavior or verify that State is working as expected. The tab is available while a run is in progress and updates as resources finish.
The tab displays an Explain results table with one row per resource. You can search by resource name and download the full results as a text file.
Expand a row to see the full decision details. Not all analyses apply to every resource type:
| Field | Description |
|---|---|
| Resource name | The name of the resource. |
| Resource type | The resource type: model, seed, snapshot, test, and so on. |
| Decision | The reason dbt State rebuilt, reused, or cloned this resource. |
| Run step | The job command that ran this resource (for example, dbt build --exclude tag:ml_pipeline). |
| Table analysis | Whether the target table already exists in the schema. |
| Query analysis | Whether the resource query or its upstream queries have changed. |
| Data freshness analysis | Whether upstream data is fresh or within the configured lag_tolerance. |
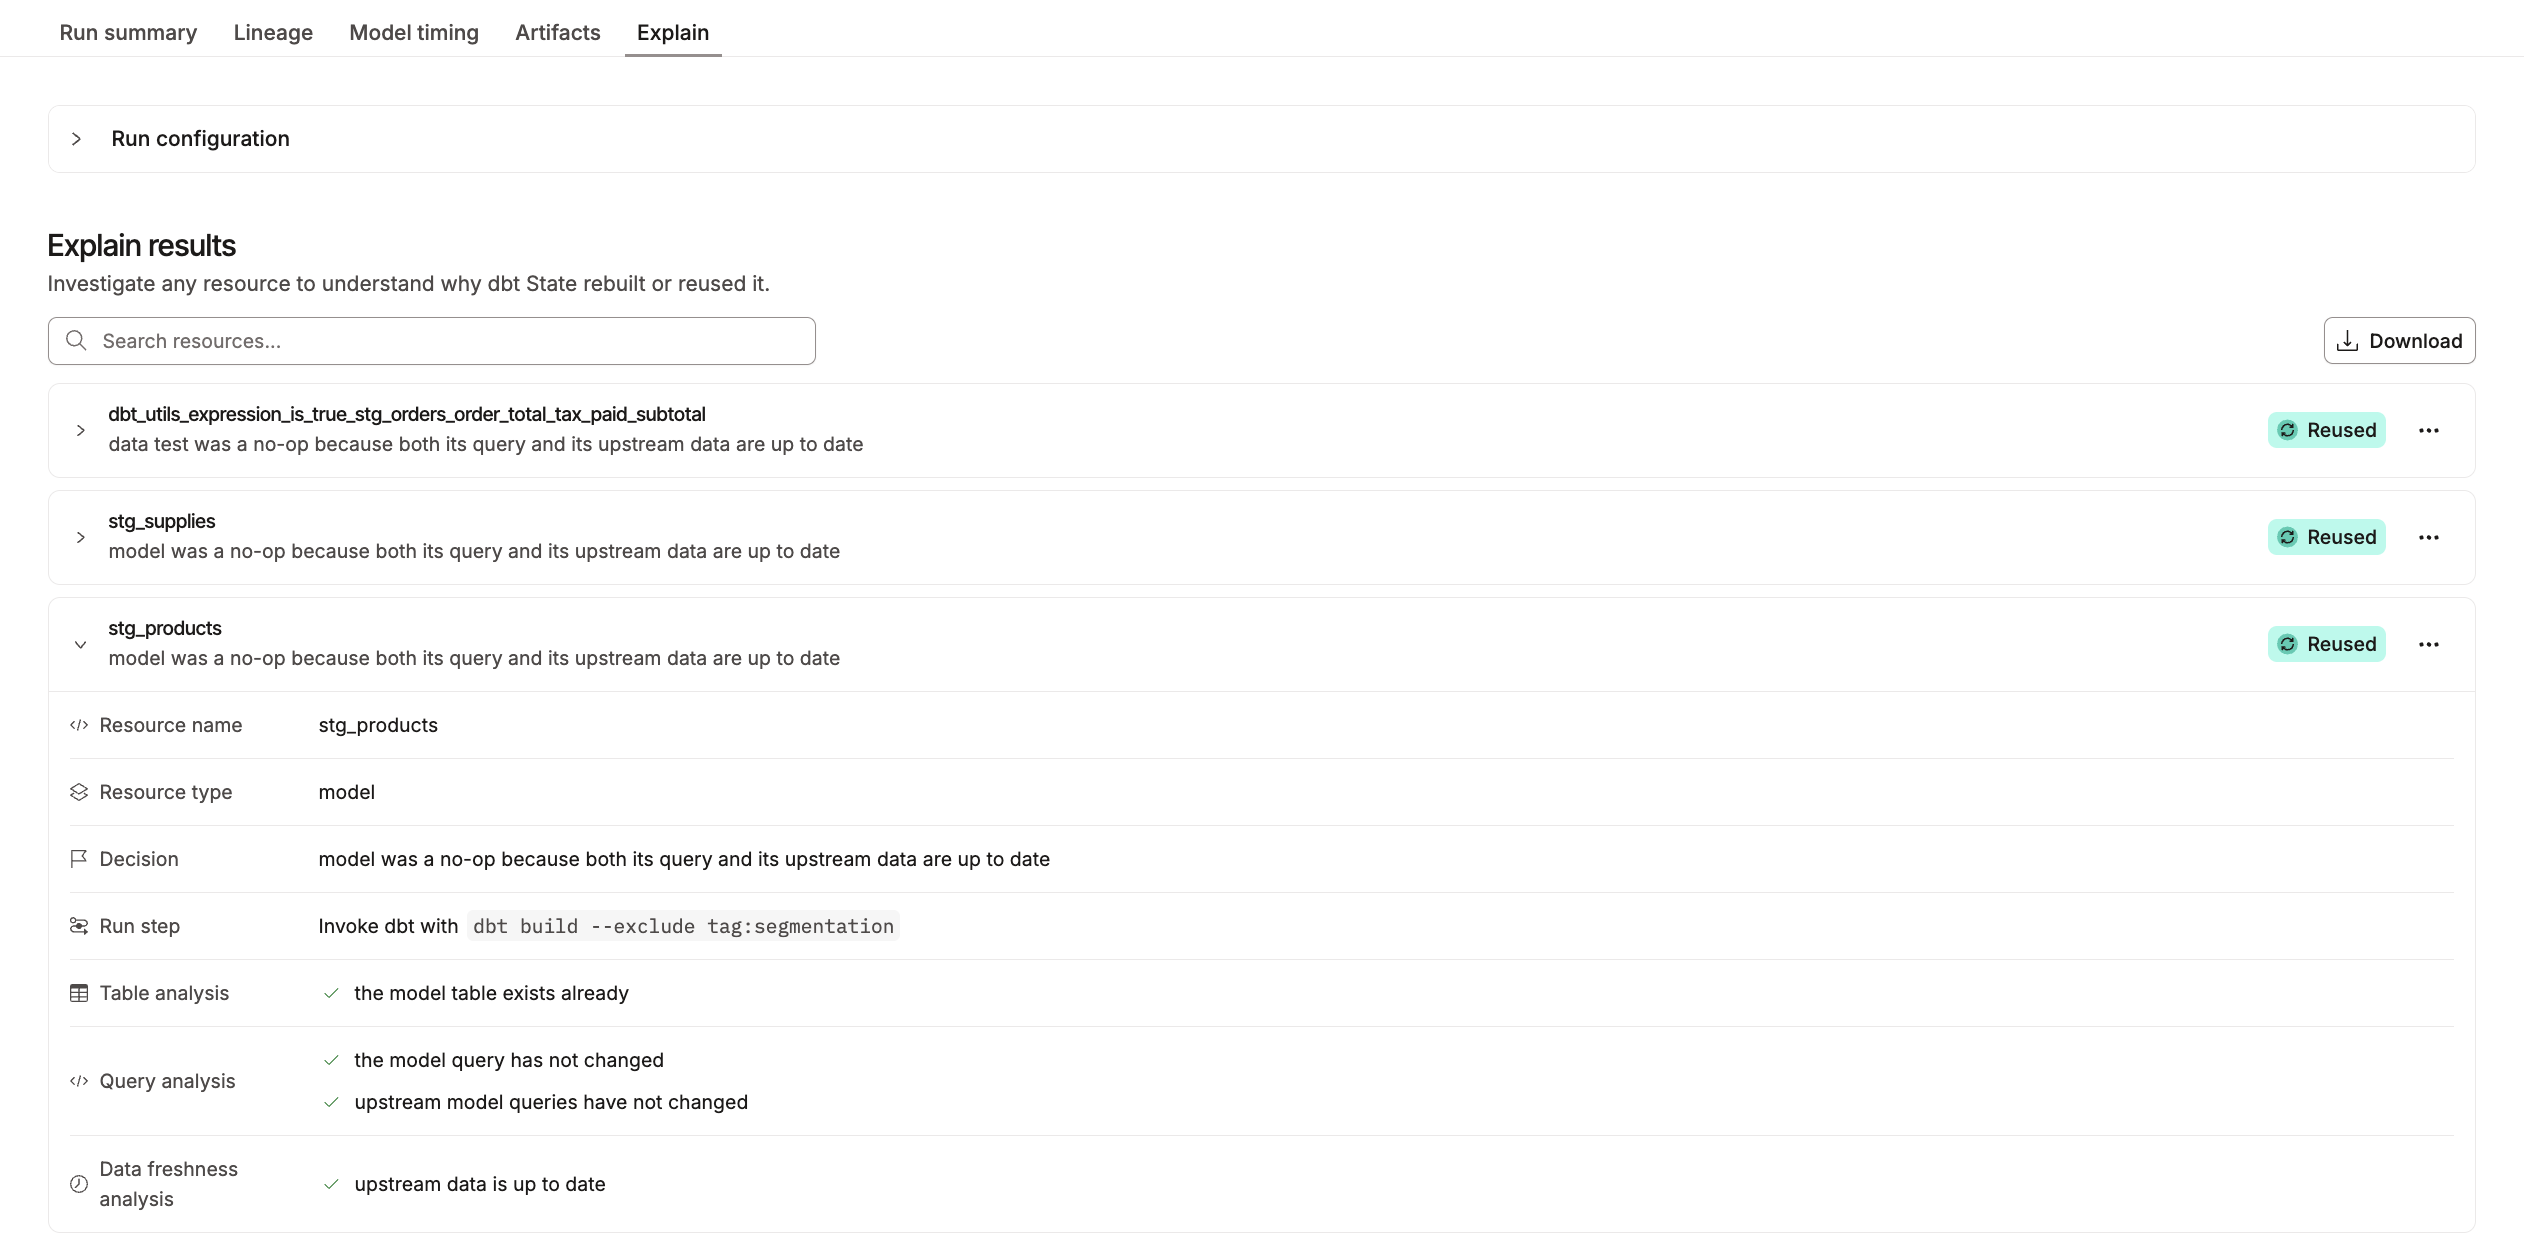 Explain tab showing the decision breakdown
Related docs
- About dbt State
- Set up dbt State
- dbt State trial and billing
- dbt State configs
lag_toleranceconfig reference- Migrate from state-aware orchestration
Was this page helpful?
This site is protected by reCAPTCHA and the Google Privacy Policy and Terms of Service apply.