dbt VS Code extension features
The dbt VS Code extension uses a dynamic Language Server Protocol (LSP) to provide a fast, intelligent, and cost-efficient dbt development experience with enhanced workflows and easy navigation.
The extension's editor features are available to all users. Some features depend on your project's static analysis mode, and a few read data from your dbt platform account.
See the feature availability tables for the full list of features and what each needs.
Feature availability
The dbt VS Code extension is free to install, and its editor features are available to all users. What's available depends on your project's static analysis mode rather than your account:
| Feature | Availability |
|---|---|
| Error diagnostics for Jinja, YAML, and SQL syntax | All users |
| Jinja LSP go-to ref, source, and macro | All users |
| Linter warning diagnostics | All users |
| Table-level lineage | All users |
| Basic dbt command UI (run, build, test, and query results) | All users |
| Ref autocomplete | All users |
| Refactor ref names | All users |
| Dialect-aware function autocomplete | All users |
| Query cache for faster incremental compiles | All users |
| Preview CTE | baseline (the default) or strict |
| SQL type and schema error diagnostics | static_analysis: strict |
| Refactor column names | static_analysis: strict |
| Column-level lineage | static_analysis: strict |
| SQL LSP go-to column and CTE | static_analysis: strict |
SQL LSP hover to see the schema for select * | static_analysis: strict |
These features need you to sign in so the extension can read data from your dbt platform account:
| Feature | Why it needs a dbt platform account |
|---|---|
| Model docs tab with platform metadata | Reads build status, descriptions, and test results from your dbt platform account. |
| Compare changes with dbt platform deferral | Fetches the deferred manifest from your dbt platform environment. You can also point it at a local manifest.json instead, with no account. |
Lightning-fast parse times
Parse even the largest projects up to 30x faster than with dbt v1. The LSP query cache makes incremental compiles faster still.
View compiled code
Get a live view of the SQL code your models will build — right alongside your dbt code.
Usage:
- Click the code icon to view compiled code side-by-side with source code.
- Compiled code will update as you save your source code.
- Clicking on a dbt macro will focus the corresponding compiled code.
- Clicking on a compiled code block will focus the corresponding source code.
Build flexibly
Use the command palette to quickly build models using complex selectors.
Usage:
- Click the dbt icon or use keyboard shortcut
cmd+shift+enter(macOS) /ctrl+shift+enter(Windows/Linux) to launch a quickpick menu. - Select a command to run.
Live error detection
Automatically validate your SQL code to detect errors and surface warnings without hitting the warehouse.
Syntax-tree diagnostics for Jinja, YAML, and SQL syntax errors (L1):
- Syntax errors (missing commas, misspelled keywords, and more)
- Hover over red squiggles to display errors
- Full diagnostic information is available in the Problems panel
L2 dbt v2 SQL comprehension diagnostics (requires static_analysis: strict):
- Missing
group byclauses, or columns that are neither grouped nor aggregated - Invalid function names or arguments
- SQL type and schema errors
- Linter warning diagnostics
Powerful IntelliSense
Autocomplete SQL functions, model names, macros, and more.
- Autocomplete
refs andsourcecalls. For example, type{{ ref(or{{ source(and you will see a list of available resources and their type complete the function call. Autocomplete doesn't trigger when replacing existing model names inside parentheses. - Dialect-aware SQL function autocomplete
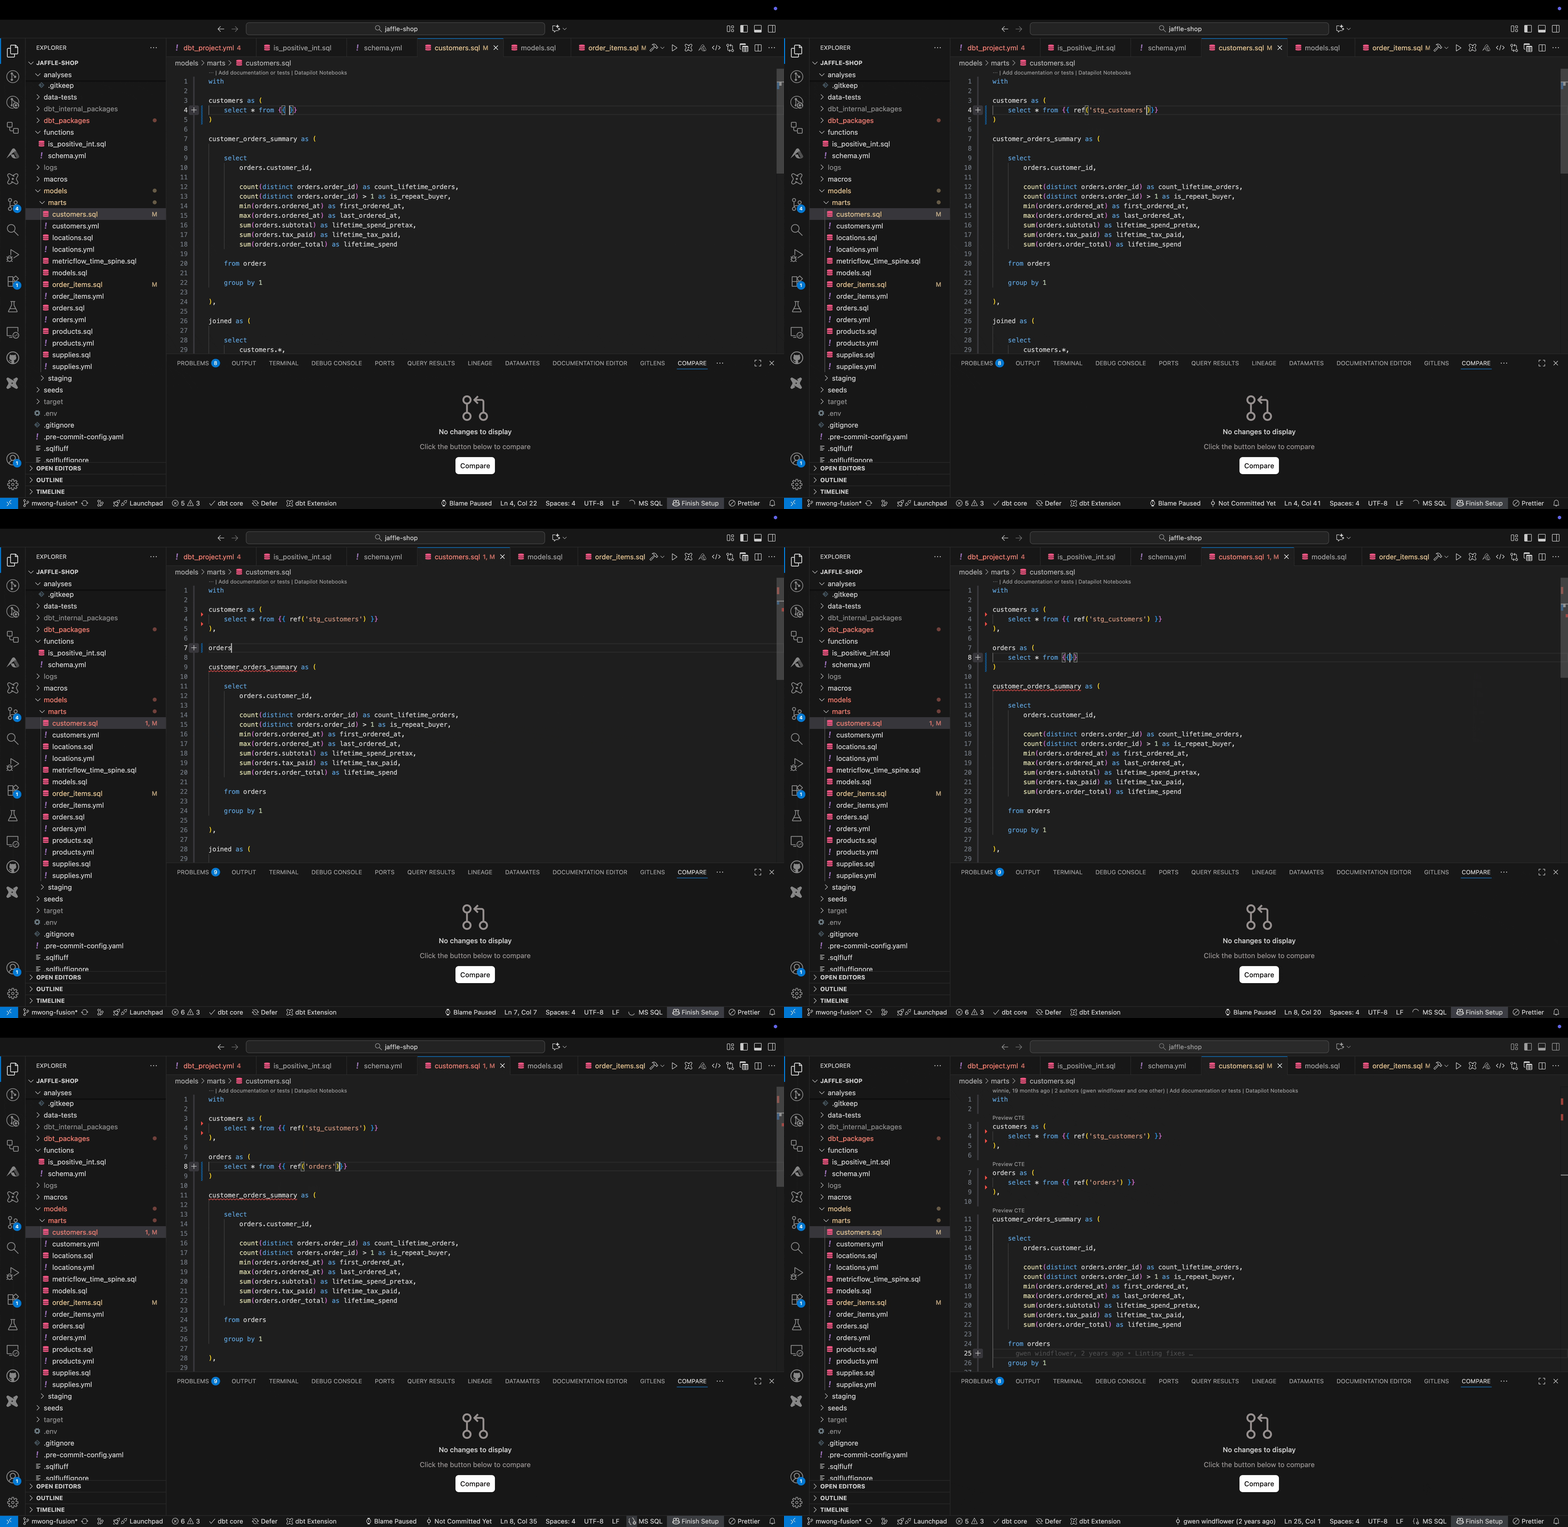 Example of the VS Code extension IntelliSense
Instant refactoring
Rename models or columns and see references update project-wide.
Renaming models:
- Right-click on a file in the file tree and select Rename.
- After renaming the file, you'll get a prompt asking if you want to make refactoring changes.
- Select OK to apply the changes, or Show Preview to display a preview of refactorings.
- After applying your changes,
refs should be updated to use the updated model name.
Renaming columns (requires static_analysis: strict):
Column renaming depends on strict static analysis, which validates column references across your project before the extension updates downstream models.
- Right-click on a column alias and select Rename Symbol.
- After renaming the column, you'll get a prompt asking if you want to make refactoring changes.
- Select OK to apply the changes, or Show Preview to show a preview of refactorings.
- After applying your changes, downstream references to the column should be updated to use the new column name.
Note: Renaming models and columns is not yet supported for snapshots, or any resources defined in a .yml file.
Go-to-definition and reference
Jump to the definition of any ref, macro, model, or column with a single click. Particularly useful in large projects with many models and macros. Excludes definitions from installed packages.
- Command or Ctrl-click to go to the definition for an identifier.
- Right-click an identifier and select Go to Definition or Go to References.
- Jinja LSP go-to-definition for
ref(),source(), and macros.
Column and CTE go-to-definition (requires static_analysis: strict):
- Go-to-definition for column names
- Go-to-definition for CTE names
Rich lineage in context
See lineage at the column or table level as you develop — no context switching or breaking flow.
Table-level lineage:
If you're using the dbt VS Code extension in Cursor, the lineage tab works best in Editor mode and doesn't render in Agent mode. If you're in Agent mode and the lineage tab isn't rendering, just switch to Editor mode to view your project's table and column lineage.
View table lineage:
- Open the Lineage tab in your editor. It will reflect table lineage focused on the currently-open file.
- Double-click nodes to open the files in your editor.
- The lineage pane updates as you navigate the files in your dbt project.
- Right-click on a node to update the DAG, or view column lineage for a node.
Column-level lineage (depends on static_analysis: strict):
View column lineage:
- Right-click on a filename, or in the SQL contents of a model file.
- Select dbt: View Lineage --> Show column lineage.
- Select the column to view lineage for.
- Double-click on a node to update the DAG selector.
- You can also use column selectors in the lineage window by adding the
column:prefix and appending the column name.
Hover insights
See context on tables, columns, and functions without leaving your code. Simply hover over any SQL element to see details like column names and data types.
Hover insights depend on static_analysis: strict, which lets the extension understand column types and function signatures across your project.
Usage:
- Hover over
*to see expanded list of columns and their types. - Hover over column name or alias to see its type.
Live preview for models and CTEs
Preview query output directly from inside your editor for faster validation and debugging.
- Click the table icon or use keyboard shortcut
cmd+enter(macOS) /ctrl+enter(Windows/Linux) to preview query results for a model or selected SQL snippet. - Results are displayed in the Query Results tab in the bottom panel.
- The preview table is sortable and results are stored until the tab is closed.
CTE preview:
- Click the Preview CTE codelens to preview CTE results.
Explore your catalog
This tab reads metadata from your dbt platform account, so you need to sign in to use it.
Open the Catalog tab to see information for the model you're working on — enriched by your dbt platform account — without leaving your editor.
For the current model, the catalog tab surfaces:
- The build status, last build time, and run duration from the dbt platform.
- The model's Description.
- The model's Columns, including each column's type, description, and test results. Sort columns alphabetically or by test name.
- A View in dbt platform link to open the resource in the dbt platform.
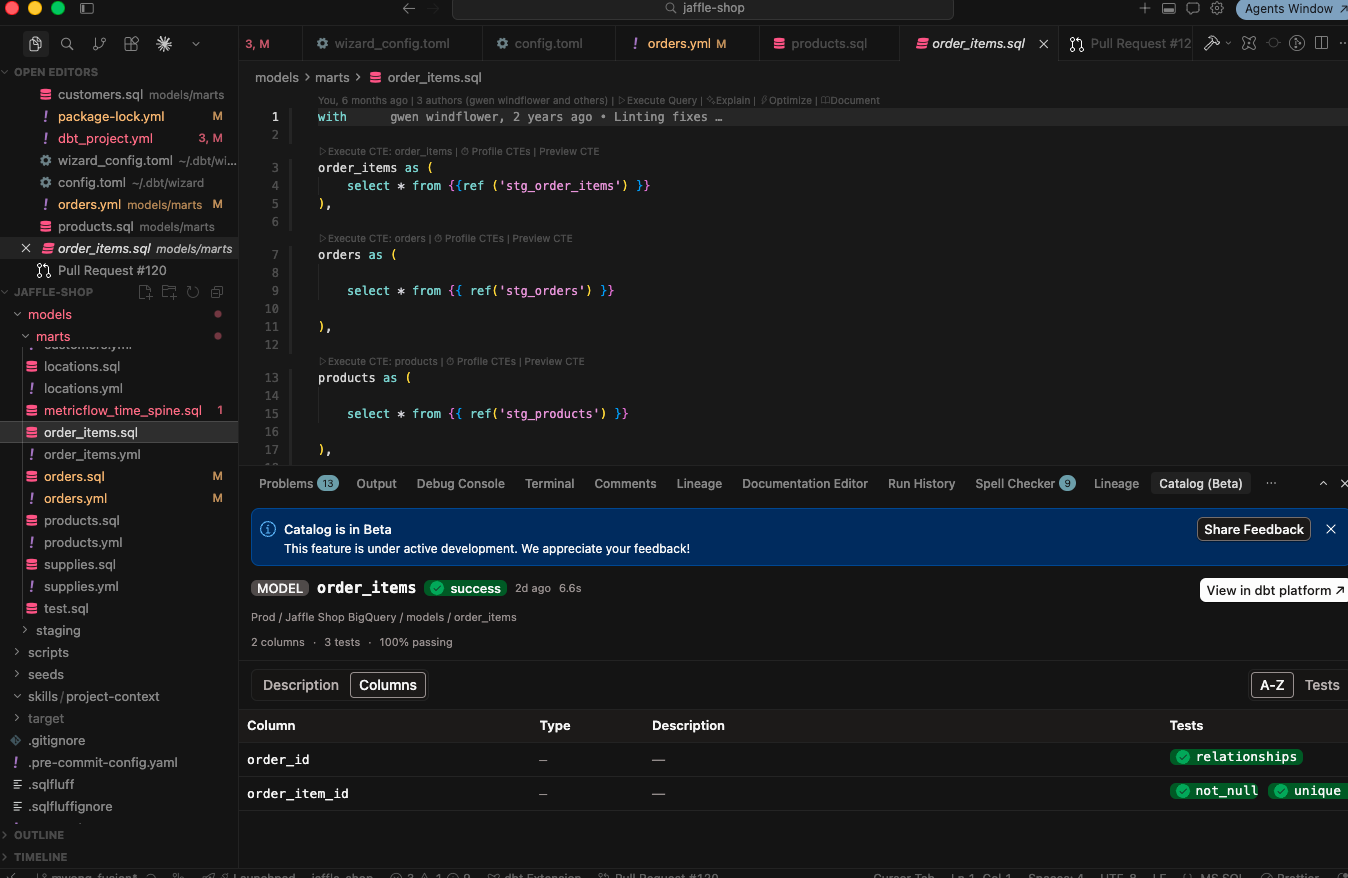 Example of the Catalog tab in the dbt VS Code extension
Generate a system report
Generate a system report to collect your VS Code extension logs and system information into a zip file. This is useful when troubleshooting issues with the dbt VS Code extension. You can share the zip file with dbt Labs support to help diagnose problems.
To generate and download a system report:
- Open the Command Palette (
Cmd+Shift+Pon macOS,Ctrl+Shift+Pon Windows/Linux). - Search for and select dbt: Generate System Report.
- Choose a location to save the .zip file when prompted.
- A notification will confirm where the file was saved.
Compare changes in development BetaEnterpriseEnterprise +
You can use compare changes, powered by dbt v2, in your local development environment to compare your current working copy against your manifest.json (for example, your last production state) directly in your editor.
For more details on how to use this feature, refer to Compare changes in local development.
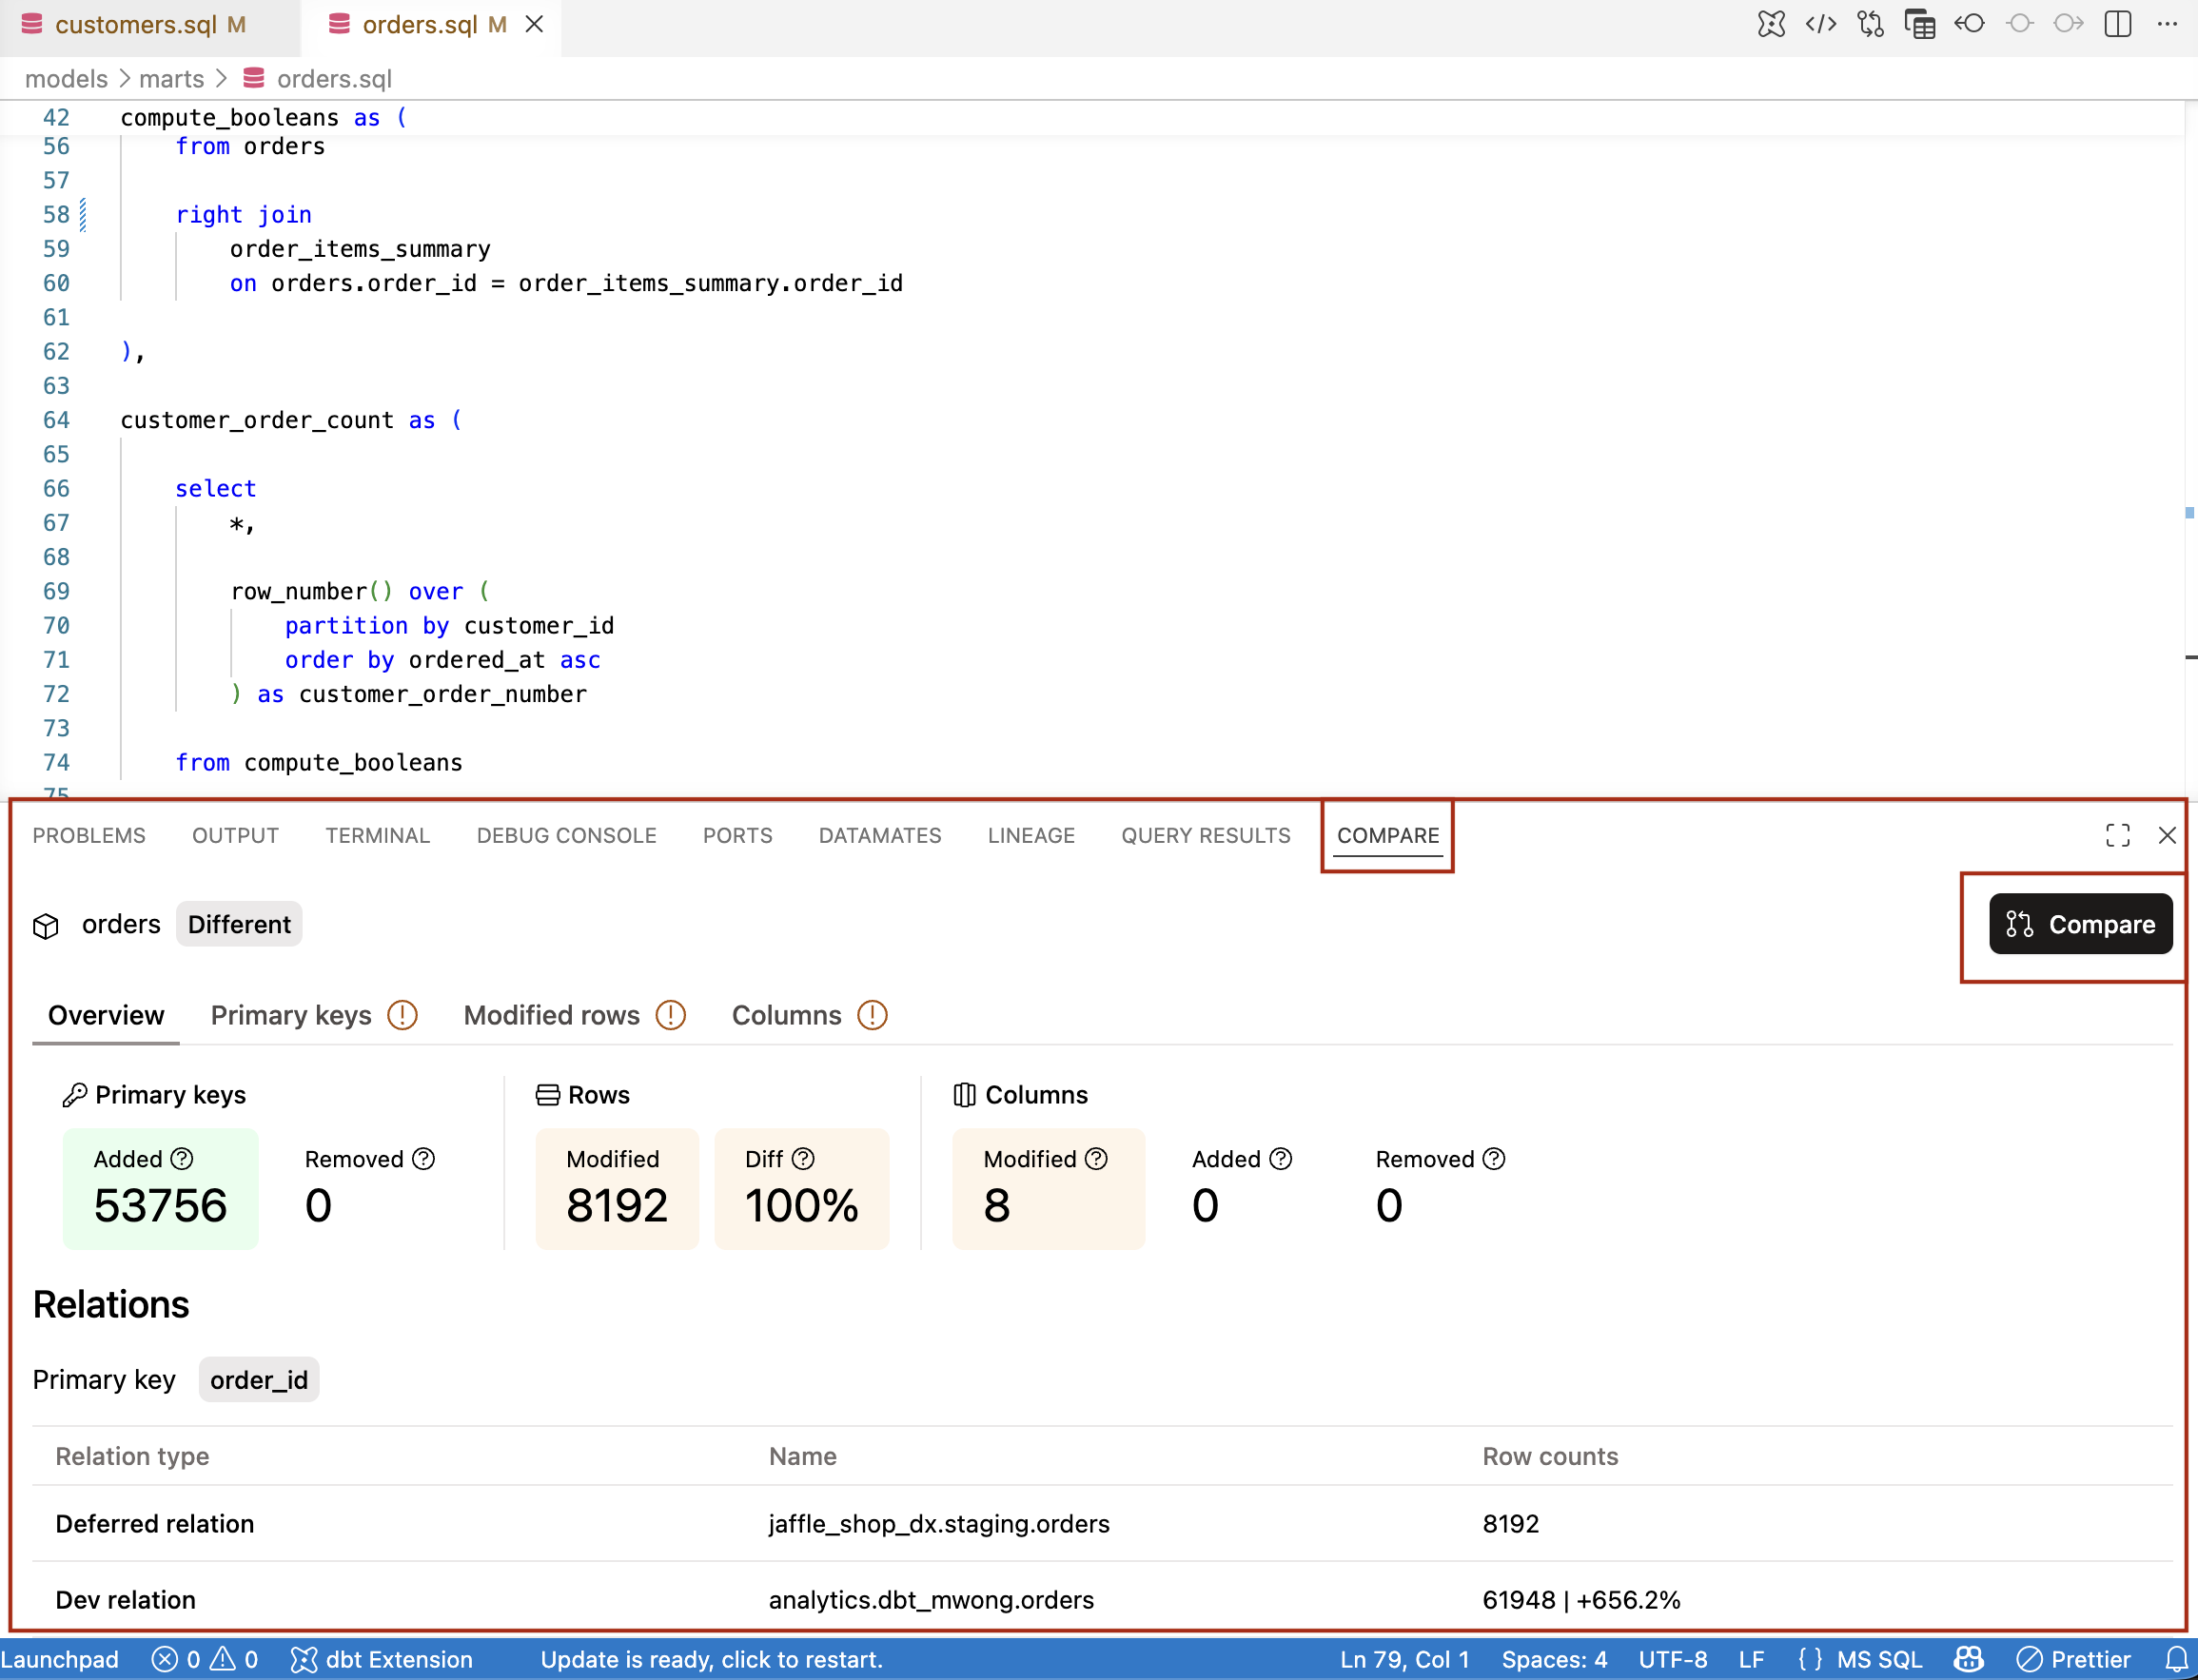 Example of the Compare tab
Was this page helpful?
This site is protected by reCAPTCHA and the Google Privacy Policy and Terms of Service apply.